Student's t-distribution and normal distribution comparison
1

library(ggplot2)
1
2
3
4
5
6
7
8
9
10

ggplot() +
  xlim(c(-5, 5)) +
  geom_function(fun = dnorm, aes(col = "normal distribution")) +
  geom_function(fun = dt, args = list(df = 5), aes(col = "df = 5")) +
  geom_function(fun = dt, args = list(df = 1), aes(col = "df = 1")) +
  geom_function(fun = dt, args = list(df = 0.1), aes(col = "df = 0.1")) +
  geom_function(fun = dt, args = list(df = 0.01), aes(col = "df = 0.01")) +
  ylab("") +
  ggtitle("Comparing t-distribution and normal distribution") +
  theme_light()
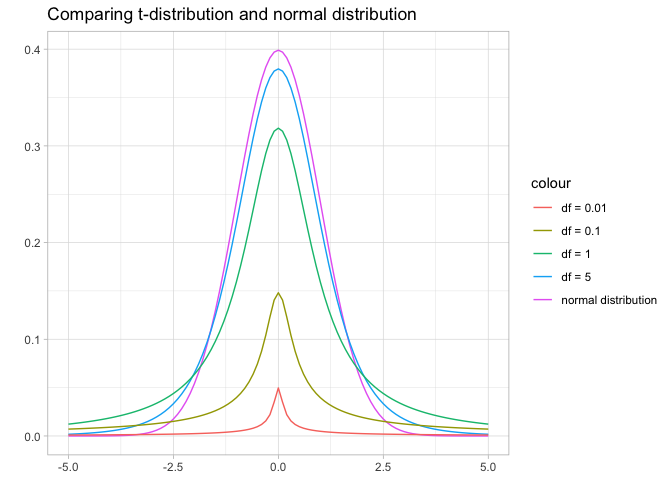
From the graph, the differences between t-distribution and normal distribution can be seen.